近年では、グラフやチャートといったインフォグラフィックを導入しているウェブサイトが増えてきています。インフォグラフィック化することでデータをよりわかりやすく表示出来たり、重要なポイントを強調したりできる、といったメリットを挙げることができます。
インフォグラフィックをウェブサイトに入れる場合、作成した画像を貼るだけでは問題ないですが、そこにアニメーションをつけるとなるとHTMLやCSS、JavaScriptを用いて作成する必要があります。HTMLやCSSでインフォグラフィックを作ろうとすると、なんだか難しそう…というイメージがあるかもしれませんが、実際には、とてもシンプルに作ることができます。どれくらい簡単か、ぜひ本記事で確認してみてください。
目次
インフォグラフィックとは
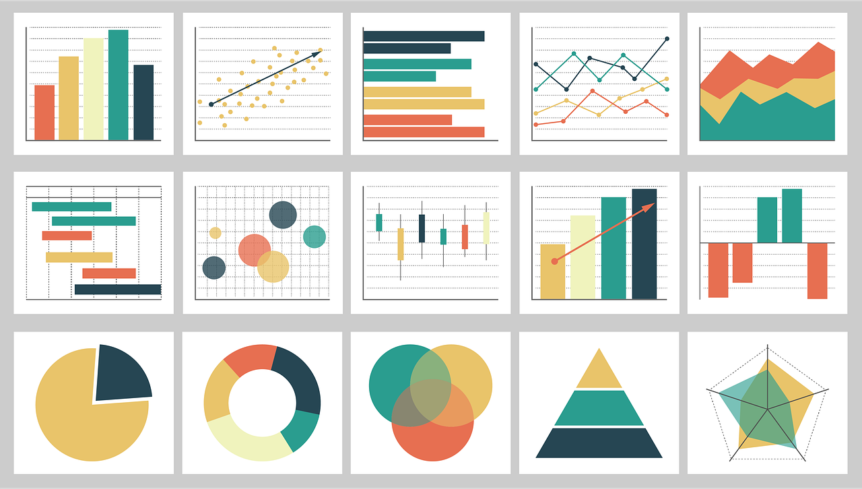
インフォグラフィック(infographics)とは、「info(情報)」を「graphics(図形)」で表すという意味の言葉です。データを視覚的にわかりやすくするために、図やグラフに要素を盛り込んだものです。数値の推移や、文字では説明しづらい情報を簡潔でわかりやすく伝えたいときに便利です。標識や地図、教科書に使われていましたが、近年ではウェブサイトにも取り入れられるようになっています。
以下のようなものがインフォグラフィックに当てはまります。
インフォグラフィックに関するブログ記事は他にもありますので、以下も合わせてご覧ください。
本記事では4種類のインフォグラフィックの作り方を解説します。
円グラフ
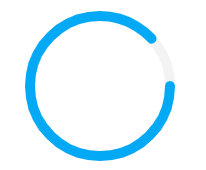
まずはこのような円グラフを作っていきます。

円をSVGで作る
まずは円グラフの円を作ります。SVGタグのcircleで円を描きます。
1 2 3 4 5 | <svg> <circle cx="75" cy="75" r="70"></circle> <svg> |
設定項目は以下の通りです。
| cx | 円のX軸の中心座標 |
|---|---|
| cy | 円のY軸の中心座標 |
| r | 半径 |
cxとcyを0にしたとき、円の中心部が0地点に来るイメージです。

svgエリアの中心に円が来るよう、cxとcyを調整しましょう。
1 2 3 4 5 6 | <svg> <circle cx="75" cy="75" r="70"></circle> <circle cx="75" cy="75" r="70"></circle> </svg> |
次に、SVGのエリアと円の大きさをCSSで調整します。円の半径を70px(直径140px)で設定しましたが、円に10pxの枠線を付けてグラフの線にするため、その太さを考慮しエリアは円の直径よりも少し大きくしています。
1 2 3 4 5 6 7 | svg { position: relative; width: 150px; height: 150px; } |
circleは以下のような設定です。
1 2 3 4 5 6 7 8 9 10 11 | svg circle { position: relative; fill: none; stroke-width: 10; stroke: #f3f3f3; stroke-dasharray: 440; stroke-dashoffset: 0; stroke-linecap: round; } |
設定項目は以下の通りです。
| fill | 塗りつぶし |
|---|---|
| stroke-width | 線の太さ |
| stroke | 線の色 |
| stroke-dasharray | 線の間隔 |
| stroke-dashoffset | 線が始まる位置 |
| stroke-linecap | パスの端の形を変える(roundは円) |
今回は直径140pxの円なので、外周を求めるには140px × π = 439.822…px(四捨五入して440px)となります。そのため、線が始まる位置を0pxにし、線の間隔は開けなくてよいので440pxにしています。これで、グレーの円が出来上がりました。

数値用の円をSVGで作る
次に、数値を表す円を作り、上に重ねます。先ほど作った円に .base というクラスを付け、新しい円に .line というクラスを付けました。
1 2 3 4 5 6 | <svg> <circle class="base" cx="75" cy="75" r="70"></circle> <circle class="line" cx="75" cy="75" r="70"></circle> </svg> |
1 2 3 4 5 6 | svg circle.line { stroke-dashoffset: calc(440 - (440 * 88) / 100); stroke: #03a9f4; } |
任意の数値までの線にしたい場合、外周 ―(外周 × 入れたい数値) ÷ 100 となります。
今回は入れたい数値を88にしているので、外周の88%の線が引かれます。
文字を入れる
このままでも円グラフとして成り立っていますが、より数値などがわかりやすいようテキスト情報を入れたいと思います。
.number の中に数値とパーセント記号、.text にグラフの名前を入れてみました。
1 2 3 4 5 6 7 8 9 10 11 12 | <div class="percent"> <svg> <circle class="base" cx="75" cy="75" r="70"></circle> <circle class="line" cx="75" cy="75" r="70"></circle> </svg> <div class="number"> <h3 class="title">88<span>%</span></h3> </div> <p class="text">Graph 01</p> </div> |
そして、これらを修飾します。
.number は絶対配置で円の中心に移動させ、数字とパーセント記号のジャンプ率を変えます。
グラフの名前は真ん中寄せにしてみました。
1 2 3 4 5 6 7 8 9 10 11 12 13 14 15 16 17 18 19 20 21 22 23 24 25 | .box .percent .number { position: absolute; top: 0; left: 0; width: 100%; height: 100%; display: flex; align-items: center; justify-content: center; color: #111; } .box .percent .number .title { font-size: 50px; } .box .percent .number .title span { font-size: 22px; } .box .text { padding: 10px 0 0; text-align: center; font-weight: bold; font-size: 14px; } |
すると、このような形になります。

アニメーションを付ける
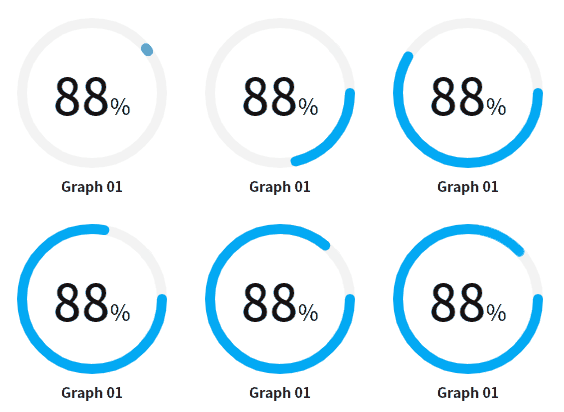
.line(色のついたほうの線)に対してアニメーションをつけます。1秒で、線の長さが0から440pxになる、というものです。
1 2 3 4 5 6 7 8 9 10 11 12 13 14 | .line { animation: circleAnim 1s forwards; } @keyframes circleAnim { 0% { stroke-dasharray: 0 440; } 99.9%, to { stroke-dasharray: 440 440; } } |
すると、このように動きます。
円グラフの開始位置を上にする
現在、グラフが右から始まる状態になっています。これでも問題はありませんが、上から始まるグラフのほうが慣れ親しんでいるかと思いますので、グラフを回転して調整します。
1 2 3 4 5 | .box .percent svg { transform: rotate(-90deg); } |
このように、上から始まる円グラフになりました。

複製する
色ごとにクラスを変えて複製してみました。

HTML
1 2 3 4 5 6 7 8 9 10 11 12 13 14 15 16 17 18 19 20 21 22 23 24 25 26 27 28 29 30 31 32 33 34 35 36 37 38 39 40 41 42 43 | <div id="pie-chart" class="content"> <h2 class="c-title">円グラフ</h2> <div class="pie-chart-wrap"> <div class="box blue"> <div class="percent"> <svg> <circle class="base" cx="75" cy="75" r="70"></circle> <circle class="line" cx="75" cy="75" r="70"></circle> </svg> <div class="number"> <h3 class="title">88<span>%</span></h3> </div> <p class="text">Graph 01</p> </div> </div> <div class="box red"> <div class="percent"> <svg> <circle class="base" cx="75" cy="75" r="70"></circle> <circle class="line" cx="75" cy="75" r="70"></circle> </svg> <div class="number"> <h3 class="title">65<span>%</span></h3> </div> <p class="text">Graph 02</p> </div> </div> <div class="box green"> <div class="percent"> <svg> <circle class="base" cx="75" cy="75" r="70"></circle> <circle class="line" cx="75" cy="75" r="70"></circle> </svg> <div class="number"> <h3 class="title">27<span>%</span></h3> </div> <p class="text">Graph 03</p> </div> </div> </div> </div> |
CSS
1 2 3 4 5 6 7 8 9 10 11 12 13 14 15 16 17 18 19 20 21 22 23 24 25 26 27 28 29 30 31 32 33 34 35 36 37 38 39 40 41 42 43 44 45 46 47 48 49 50 51 52 53 54 55 56 57 58 59 60 61 62 63 64 65 66 67 68 69 70 71 72 73 74 75 76 77 78 79 80 81 82 83 84 85 86 87 88 89 90 91 92 93 94 95 96 97 98 99 100 101 102 103 104 105 106 107 108 109 110 111 112 113 114 115 116 117 118 119 120 121 122 123 124 125 126 127 128 129 130 131 132 133 134 135 136 137 138 139 140 | /*------------------------------------ pie chart ------------------------------------*/ @media screen and (min-width: 751px) { .pie-chart-wrap { display: -webkit-box; display: -ms-flexbox; display: flex; -webkit-box-pack: center; -ms-flex-pack: center; justify-content: center; -webkit-box-align: center; -ms-flex-align: center; align-items: center; } } .box { position: relative; min-width: 200px; width: 33.3333333333%; height: 300px; display: -webkit-box; display: -ms-flexbox; display: flex; -webkit-box-pack: center; -ms-flex-pack: center; justify-content: center; -webkit-box-align: center; -ms-flex-align: center; align-items: center; -webkit-box-orient: vertical; -webkit-box-direction: normal; -ms-flex-direction: column; flex-direction: column; background: #fff; -webkit-box-shadow: 0 15px 30px rgba(0, 0, 0, 0.2); box-shadow: 0 15px 30px rgba(0, 0, 0, 0.2); } @media screen and (max-width: 750px) { .box { width: 100%; } } @media screen and (min-width: 751px) { .box + .box { margin-left: 20px; } } @media screen and (max-width: 750px) { .box + .box { margin-top: 20px; } } .box .percent { position: relative; width: 150px; height: 150px; } .box .percent svg { position: relative; width: 150px; height: 150px; -webkit-transform: rotate(-90deg); transform: rotate(-90deg); } .box .percent svg circle { position: relative; fill: none; stroke-width: 10; stroke: #f3f3f3; stroke-dasharray: 440; stroke-dashoffset: 0; stroke-linecap: round; } .box .percent .number { position: absolute; top: 0; left: 0; width: 100%; height: 100%; display: -webkit-box; display: -ms-flexbox; display: flex; -webkit-box-align: center; -ms-flex-align: center; align-items: center; -webkit-box-pack: center; -ms-flex-pack: center; justify-content: center; color: #111; } .box .percent .number .title { font-size: 50px; } .box .percent .number .title span { font-size: 22px; } .box .text { padding: 10px 0 0; text-align: center; font-weight: bold; font-size: 14px; } .box .percent .line { -webkit-animation: circleAnim 1s forwards; animation: circleAnim 1s forwards; } .box.blue .percent .line { stroke-dashoffset: 52.8; stroke: #03a9f4; } .box.red .percent .line { stroke-dashoffset: 154; stroke: #ff3051; } .box.green .percent .line { stroke-dashoffset: 321.2; stroke: #1fd26c; } @-webkit-keyframes circleAnim { 0% { stroke-dasharray: 0 440; } 99.9%, to { stroke-dasharray: 440 440; } } @keyframes circleAnim { 0% { stroke-dasharray: 0 440; } 99.9%, to { stroke-dasharray: 440 440; } } |
棒グラフ
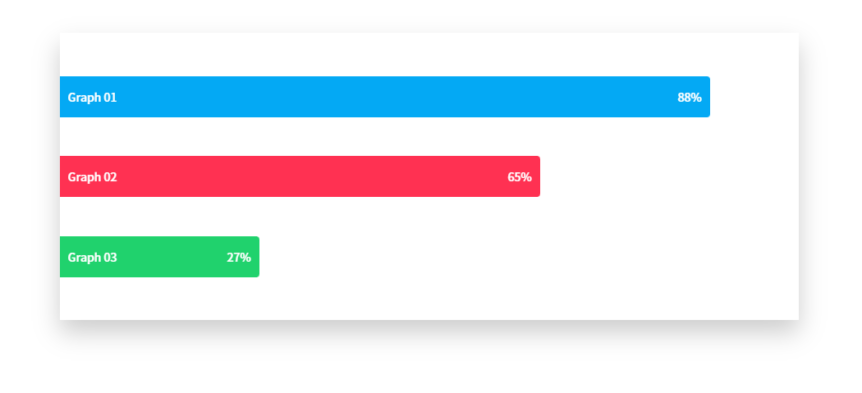
横に伸びる棒グラフを作っていきます。
棒グラフを作る
棒グラフ用の .graph と、その大枠 .bar-graph-wrap 用意します。今は中身が空で大丈夫です。
1 2 3 | <div class="bar-graph-wrap"> <div class="graph"></div> </div> |
CSSで、グラフの大枠の高さを固定しました。
1 2 3 4 5 | .bar-graph-wrap { position: relative; height: 350px; box-shadow: 0 15px 30px rgba(0, 0, 0, 0.2); } |
グラフは絶対配置にし、表したいパーセンテージをwidthで指定します。今回は88%としたかったので、widthも88%にしています。
1 2 3 4 5 6 7 8 9 10 11 | .bar-graph-wrap .graph { height: 50px; position: absolute; left: 0; top: 0; bottom: 0; margin: auto; background: #03a9f4; width: 88%; border-radius: 0 4px 4px 0; } |
すると、このような形になります。

グラフ名と数値のテキストを入れる
表示する場所を変えたいので、グラフ名と数値のテキストはそれぞれspanで囲いました。
1 2 3 4 | <div class="graph"> <span class="name">Graph 01</span> <span class="number">88%</span> </div> |
1 2 3 4 | .graph span { font-size: 14px; color: #ffffff; } |
両端に配置したかったので、display: flex; にし、justify-content: space-between; を用いています。
要素の端にくっついてほしくなかったので、paddingで内側に余白をとっています。
1 2 3 4 5 6 | .bar-graph-wrap .graph { display: flex; align-items: center; justify-content: space-between; padding: 10px; } |
すると、このような形になります。

アニメーション化する
以下は棒グラフが左から伸びるように、グラフの位置を左方向へ-100%にし、3秒かけて右に移動するというアニメーションです。
1 2 3 | .bar-graph-wrap .graph { animation: graphAnim 3s forwards; } |
1 2 3 4 5 6 7 8 | @keyframes graphAnim { 0% { transform: translateX(-100%); } 100% { transform: translateX(0); } } |
大枠の外からグラフが右へ流れるので、枠の外にいるときは非表示にするために、overflow: hidden; にしました。
1 2 3 | .bar-graph-wrap { overflow: hidden; } |
すると、このようににゅるっと伸びるような動きになります。

複製する
色ごとにクラスを変えて複製してみました。

HTML
1 2 3 4 5 6 7 8 9 10 11 12 13 14 15 16 17 18 19 | <div id="bar-graph" class="content"> <h2 class="c-title">棒グラフ</h2> <div class="bar-graph-wrap"> <div class="graph blue"> <span class="name">Graph 01</span> <span class="number">88%</span> </div> <div class="graph red"> <span class="name">Graph 02</span> <span class="number">65%</span> </div> <div class="graph green"> <span class="name">Graph 03</span> <span class="number">27%</span> </div> </div> </div> |
CSS
1 2 3 4 5 6 7 8 9 10 11 12 13 14 15 16 17 18 19 20 21 22 23 24 25 26 27 28 29 30 31 32 33 34 35 36 37 38 39 40 41 42 43 44 45 46 47 48 49 50 51 52 53 54 55 56 57 58 59 60 61 62 63 64 65 66 67 68 69 70 71 72 73 74 75 76 77 78 | /*------------------------------------ bar graph ------------------------------------*/ .bar-graph-wrap { position: relative; height: 350px; -webkit-box-shadow: 0 15px 30px rgba(0, 0, 0, 0.2); box-shadow: 0 15px 30px rgba(0, 0, 0, 0.2); overflow: hidden; } .bar-graph-wrap .graph { height: 50px; position: absolute; left: 0; border-radius: 0 4px 4px 0; display: -webkit-box; display: -ms-flexbox; display: flex; -webkit-box-align: center; -ms-flex-align: center; align-items: center; -webkit-box-pack: justify; -ms-flex-pack: justify; justify-content: space-between; padding: 10px; -webkit-animation: graphAnim 2.5s forwards; animation: graphAnim 2.5s forwards; } .bar-graph-wrap .graph span { font-size: 14px; color: #ffffff; } @media screen and (max-width: 750px) { .bar-graph-wrap .graph span { font-size: 12px; } } .bar-graph-wrap .graph.blue { top: 15%; background: #03a9f4; width: 88%; } .bar-graph-wrap .graph.red { top: 0; bottom: 0; margin: auto; background: #ff3051; width: 65%; } .bar-graph-wrap .graph.green { bottom: 15%; background: #1fd26c; width: 27%; } @-webkit-keyframes graphAnim { 0% { -webkit-transform: translateX(-100%); transform: translateX(-100%); } 100% { -webkit-transform: translateX(0); transform: translateX(0); } } @keyframes graphAnim { 0% { -webkit-transform: translateX(-100%); transform: translateX(-100%); } 100% { -webkit-transform: translateX(0); transform: translateX(0); } } |
棒グラフ(横)
縦に伸びる棒グラフにするやり方を紹介します。
先ほど作った棒グラフをベースにしており、追加になるCSSのみ記載します。
縦にしたいグラフの大枠に .vertical というクラスを付けました。そして、縦の長さを少し長くし、横幅いっぱいですとグラフが見づらくなるので幅を狭めました。これはグラフの本数によって適宜調整すればよいかと思います。
1 2 3 4 5 | .bar-graph-wrap.vertical { height: 500px; margin: 0 auto; max-width: 350px; } |
グラフは縦幅が50pxに固定されていましたが、横幅を固定値にし、縦はパーセンテージによって変化するようにします。縦に伸びるのに合わせ、角丸(border-radius)の場所も変更しました。下からの位置を0pxで固定しています。
1 2 3 4 5 6 7 | .bar-graph-wrap.vertical .graph { width: 50px; bottom: 0; border-radius: 4px 4px 0 0; animation: graphAnim02 3s forwards; flex-direction: column-reverse; } |
グラフの横幅を狭めたことでテキストが見づらくなったので、フォントサイズを下げました。
1 2 3 | .bar-graph-wrap.vertical .graph .name { font-size: 10px; } |
グラフの位置を調整します。パーセンテージは高さ(height)で指定できます。
1 2 3 4 5 | .bar-graph-wrap.vertical .graph { left: 15%; height: 88%; top: auto; } |
アニメーションはY軸ベースにすることで、下から上に来るような縦のアニメーションになります。
1 2 3 4 5 6 7 8 | @keyframes graphAnim02 { 0% { transform: translateY(100%); } 100% { transform: translateY(0); } } |
すると、このように縦に伸びる棒グラフにすることができます。

レーダーチャート
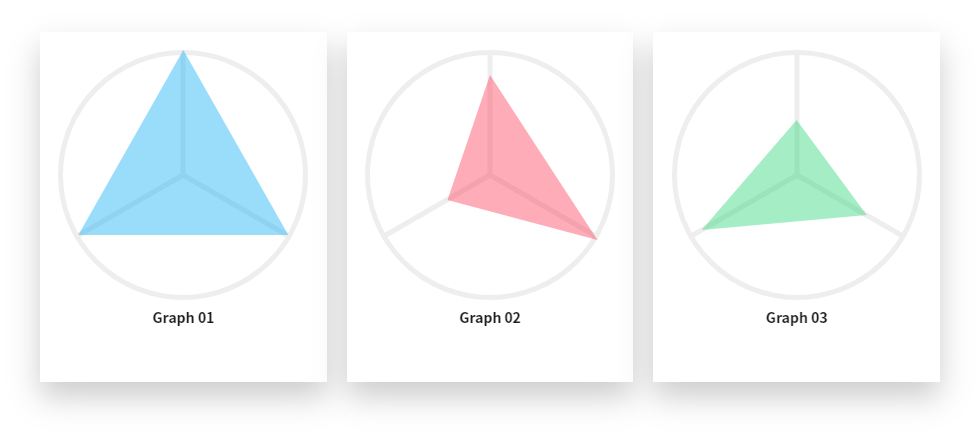
3つの頂点があるレーダーチャートを作ります。
背景を作る
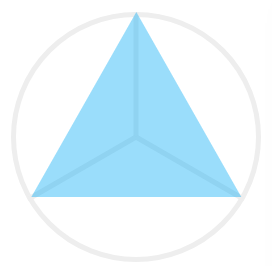
グラフ用の背景を作ります。CSSで作るのは大変なので、画像を用意しました。

この画像を、グラフの背景に設置します。
.graph-bg という枠を作り、背景に画像が当たるようにしました。
1 | <div class="graph-bg"></div> |
1 2 3 4 5 6 | .graph-bg { width: 250px; height: 250px; margin: 0 auto; background: url("../img/graph03_bg.png") no-repeat center/contain; } |
グラフを作る
先ほど作った背景用の.graph-bg の中に、グラフ用の .rader を作ります。
1 2 3 | <div class="graph-bg"> <div class="rader"></div> </div> |
1 2 3 4 5 6 7 | .rader-graph-wrap .rader{ margin: 0 auto; width: 250px; height: 250px; clip-path: polygon(50% 17%, 2% 100%, 77% 87%); background: rgba(3, 169, 244, 0.4); } |
グラフはclip-pathで作成しています。clip-path では指定した領域は表示し、外側は非表示にするというクリッピング領域を作ることができます。今回使っているpolygonは多角形を作るためのプロパティです。このように指定します。
1 | polygon(X軸の頂点 Y軸の頂点, X軸の頂点 Y軸の頂点, X軸の頂点 Y軸の頂点) |
clip-pathにはこのようなジェネレーターもあるので、よかったら参考にしてみてください。
CSS clip-path maker
アニメーションを作る
clip-path のサイズを0から100%にするアニメーションをあてています。こうすると、グラフが伸びるような表現になります。
1 2 3 4 5 6 7 8 9 10 11 | .rader { animation: graphAnim03 3s forwards; } @keyframes graphAnim03 { 0% { clip-path: polygon(50% 50%, 50% 50%, 50% 50%); } 100% { clip-path: polygon(0, 0, 0); } } |
複製する
色ごとにクラスを変えて複製してみました。

HTML
1 2 3 4 5 6 7 8 9 10 11 12 13 14 15 16 17 18 19 20 21 22 23 24 25 | <div id="bar-rader" class="content"> <h2 class="c-title">レーダーチャート</h2> <div class="rader-graph-wrap"> <div class="box blue"> <div class="graph-bg"> <div class="rader"></div> </div> <p class="text">Graph 01</p> </div> <div class="box red"> <div class="graph-bg"> <div class="rader"></div> </div> <p class="text">Graph 02</p> </div> <div class="box green"> <div class="graph-bg"> <div class="rader"></div> </div> <p class="text">Graph 03</p> </div> </div> </div> |
CSS
1 2 3 4 5 6 7 8 9 10 11 12 13 14 15 16 17 18 19 20 21 22 23 24 25 26 27 28 29 30 31 32 33 34 35 36 37 38 39 40 41 42 43 44 45 46 47 48 49 50 51 52 53 54 55 56 57 58 59 60 61 62 63 64 65 66 67 68 69 70 71 72 73 74 75 76 77 78 79 80 81 82 83 84 85 86 87 88 89 90 91 92 93 94 95 96 97 98 99 100 101 102 103 104 105 106 107 108 109 | /*------------------------------------ rader ------------------------------------*/ @media screen and (min-width: 751px) { .rader-graph-wrap { display: -webkit-box; display: -ms-flexbox; display: flex; -webkit-box-pack: center; -ms-flex-pack: center; justify-content: center; } } .rader-graph-wrap .box { background: #fff; -webkit-box-shadow: 0 15px 30px rgba(0, 0, 0, 0.2); box-shadow: 0 15px 30px rgba(0, 0, 0, 0.2); display: -webkit-box; display: -ms-flexbox; display: flex; -webkit-box-align: center; -ms-flex-align: center; align-items: center; -webkit-box-pack: center; -ms-flex-pack: center; justify-content: center; -webkit-box-orient: vertical; -webkit-box-direction: normal; -ms-flex-direction: column; flex-direction: column; padding-bottom: 40px; } @media screen and (min-width: 751px) { .rader-graph-wrap .box { min-width: 220px; width: 33.3333333333%; height: 350px; } } @media screen and (min-width: 751px) { .rader-graph-wrap .box + .box { margin-left: 20px; } } @media screen and (max-width: 750px) { .rader-graph-wrap .box + .box { margin-top: 50px; } } .rader-graph-wrap .graph-bg { width: 250px; height: 250px; margin: 0 auto; background: url("../img/graph03_bg.png") no-repeat center/contain; } .rader-graph-wrap .rader { margin: 0 auto; width: 250px; height: 250px; -webkit-clip-path: polygon(50% 0, 0 100%, 100% 100%); clip-path: polygon(50% 0, 0 100%, 100% 100%); background-color: rgba(80, 220, 220, 0.4); -webkit-animation: graphAnim03 3s forwards; animation: graphAnim03 3s forwards; } .rader-graph-wrap .blue .rader { background: rgba(3, 169, 244, 0.4); -webkit-clip-path: polygon(50% 17%, 2% 100%, 77% 87%); clip-path: polygon(50% 17%, 2% 100%, 77% 87%); } .rader-graph-wrap .red .rader { background: rgba(255, 48, 81, 0.4); -webkit-clip-path: polygon(50% 5%, 27% 84%, 96% 98%); clip-path: polygon(50% 5%, 27% 84%, 96% 98%); } .rader-graph-wrap .green .rader { background: rgba(31, 210, 108, 0.4); -webkit-clip-path: polygon(50% 58%, 6% 97%, 100% 100%); clip-path: polygon(50% 58%, 6% 97%, 100% 100%); } .rader-graph-wrap .text { text-align: center; font-weight: bold; } @-webkit-keyframes graphAnim03 { 0% { -webkit-clip-path: polygon(50% 50%, 50% 50%, 50% 50%); clip-path: polygon(50% 50%, 50% 50%, 50% 50%); } 100% { -webkit-clip-path: polygon(0, 0, 0); clip-path: polygon(0, 0, 0); } } @keyframes graphAnim03 { 0% { -webkit-clip-path: polygon(50% 50%, 50% 50%, 50% 50%); clip-path: polygon(50% 50%, 50% 50%, 50% 50%); } 100% { -webkit-clip-path: polygon(0, 0, 0); clip-path: polygon(0, 0, 0); } } |
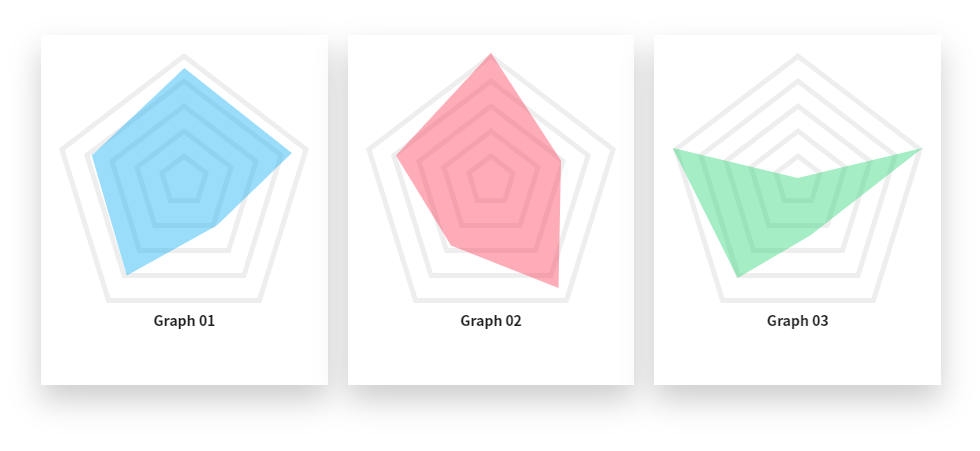
レーダーチャート(五角形)
5つの頂点があるレーダーチャートを作ります。
背景を作る
グラフ用の背景を作ります。CSSで作るのは大変なので、画像を用意しました。

この画像はXDで作りました。
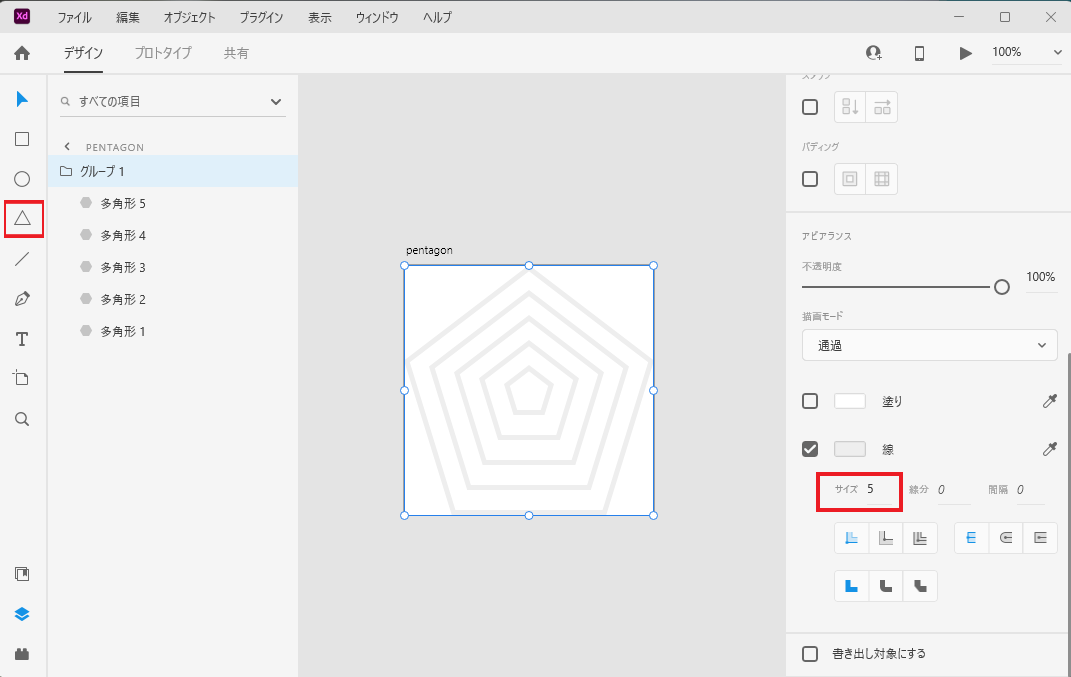
三角形作成ツールからサイズで5と入力すると、簡単に五角形を作れます。サイズを変えて4つ複製すると、このような見た目になります。
この画像を、グラフの背景に設置します。.graph-bg という枠を作り、背景に画像が当たるようにしました。
1 | <div class="graph-bg"></div> |
1 2 3 4 5 6 | .graph-bg { width: 250px; height: 250px; margin: 0 auto; background: url("../img/graph04_bg.png") no-repeat center / contain; } |
グラフを作る
先ほど作った背景用の.graph-bg の中に、グラフ用の .pentagon を作ります。
1 2 3 | <div class="graph-bg"> <div class="pentagon"></div> </div> |
1 2 3 4 5 6 7 | .pentagon { margin: 0 auto; width: 250px; height: 250px; background: rgba($blue, 0.4); clip-path: polygon(50% 6%, 93% 40%, 63% 69%, 27% 89%, 13% 41%); } |
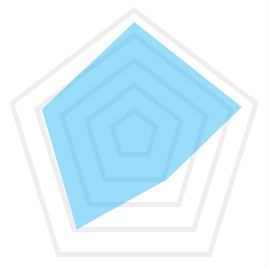
こちらのグラフもclip-pathで作成しています。五角形は[X軸の頂点 Y軸の頂点]を5つ指定して作ります。
1 | polygon(X軸の頂点 Y軸の頂点, X軸の頂点 Y軸の頂点, X軸の頂点 Y軸の頂点, X軸の頂点 Y軸の頂点) |
アニメーションを作る
clip-path のサイズを0から100%にするアニメーションをあてています。こうすると、グラフが伸びるような表現になります。
1 2 3 4 5 6 7 8 9 10 11 | .pentagon { animation: graphAnim04 3s forwards; } @keyframes graphAnim04 { 0% { clip-path: polygon(50% 50%, 50% 50%, 50% 50%, 50% 50%, 50% 50%); } 100% { clip-path: polygon(0, 0, 0, 0, 0); } } |
複製する
色ごとにクラスを変えて複製してみました。

HTML
1 2 3 4 5 6 7 8 9 10 11 12 13 14 15 16 17 18 19 20 21 22 23 24 25 | <div id="bar-rader02" class="content"> <h2 class="c-title">レーダーチャート(五角形)</h2> <div class="pentagon-graph-wrap"> <div class="box blue"> <div class="graph-bg"> <div class="pentagon"></div> </div> <p class="text">Graph 01</p> </div> <div class="box red"> <div class="graph-bg"> <div class="pentagon"></div> </div> <p class="text">Graph 02</p> </div> <div class="box green"> <div class="graph-bg"> <div class="pentagon"></div> </div> <p class="text">Graph 03</p> </div> </div> </div> |
CSS
1 2 3 4 5 6 7 8 9 10 11 12 13 14 15 16 17 18 19 20 21 22 23 24 25 26 27 28 29 30 31 32 33 34 35 36 37 38 39 40 41 42 43 44 45 46 47 48 49 50 51 52 53 54 55 56 57 58 59 60 61 62 63 64 65 66 67 68 69 70 71 72 73 74 75 76 77 78 79 80 81 82 83 84 85 86 87 88 89 90 91 92 93 94 95 96 97 98 99 100 101 102 103 104 105 106 107 108 109 110 111 | /*------------------------------------ pentagon ------------------------------------*/ @media screen and (min-width: 751px) { .pentagon-graph-wrap { display: -webkit-box; display: -ms-flexbox; display: flex; -webkit-box-pack: center; -ms-flex-pack: center; justify-content: center; } } .pentagon-graph-wrap .box { background: #fff; -webkit-box-shadow: 0 15px 30px rgba(0, 0, 0, 0.2); box-shadow: 0 15px 30px rgba(0, 0, 0, 0.2); display: -webkit-box; display: -ms-flexbox; display: flex; -webkit-box-align: center; -ms-flex-align: center; align-items: center; -webkit-box-pack: center; -ms-flex-pack: center; justify-content: center; -webkit-box-orient: vertical; -webkit-box-direction: normal; -ms-flex-direction: column; flex-direction: column; padding-bottom: 40px; } @media screen and (min-width: 751px) { .pentagon-graph-wrap .box { min-width: 220px; width: 33.3333333333%; height: 350px; } } @media screen and (min-width: 751px) { .pentagon-graph-wrap .box + .box { margin-left: 20px; } } @media screen and (max-width: 750px) { .pentagon-graph-wrap .box + .box { margin-top: 50px; } } .pentagon-graph-wrap .graph-bg { width: 250px; height: 250px; margin: 0 auto; background: url("../img/graph04_bg.png") no-repeat center/contain; } .pentagon-graph-wrap .graph { margin: auto; position: relative; width: 250px; height: 250px; } .pentagon-graph-wrap .pentagon { margin: 0 auto; width: 250px; height: 250px; -webkit-animation: graphAnim04 3s forwards; animation: graphAnim04 3s forwards; } .pentagon-graph-wrap .blue .pentagon { background: rgba(3, 169, 244, 0.4); -webkit-clip-path: polygon(50% 6%, 93% 40%, 63% 69%, 27% 89%, 13% 41%); clip-path: polygon(50% 6%, 93% 40%, 63% 69%, 27% 89%, 13% 41%); } .pentagon-graph-wrap .red .pentagon { background: rgba(255, 48, 81, 0.4); -webkit-clip-path: polygon(50% 0%, 78% 43%, 77% 94%, 34% 77%, 12% 41%); clip-path: polygon(50% 0%, 78% 43%, 77% 94%, 34% 77%, 12% 41%); } .pentagon-graph-wrap .green .pentagon { background: rgba(31, 210, 108, 0.4); -webkit-clip-path: polygon(50% 50%, 100% 38%, 55% 73%, 26% 90%, 0% 38%); clip-path: polygon(50% 50%, 100% 38%, 55% 73%, 26% 90%, 0% 38%); } .pentagon-graph-wrap .text { text-align: center; font-weight: bold; } @-webkit-keyframes graphAnim04 { 0% { -webkit-clip-path: polygon(50% 50%, 50% 50%, 50% 50%, 50% 50%, 50% 50%); clip-path: polygon(50% 50%, 50% 50%, 50% 50%, 50% 50%, 50% 50%); } 100% { -webkit-clip-path: polygon(0, 0, 0, 0, 0); clip-path: polygon(0, 0, 0, 0, 0); } } @keyframes graphAnim04 { 0% { -webkit-clip-path: polygon(50% 50%, 50% 50%, 50% 50%, 50% 50%, 50% 50%); clip-path: polygon(50% 50%, 50% 50%, 50% 50%, 50% 50%, 50% 50%); } 100% { -webkit-clip-path: polygon(0, 0, 0, 0, 0); clip-path: polygon(0, 0, 0, 0, 0); } } |
まとめ
ということで、いくつかのインフォグラフィックの作り方を本記事でまとめました。どれもHTMLとCSSのみでできるので、比較的導入しやすいかなと思います。
今回はHTMLとCSSを使ったものに絞りましたが、インフォグラフィックに特化したJavaScriptライブラリも何種類かあります。次のレベルにステップアップしてみたい!という方は以下のようなライブラリも参考にしてみてはいかがでしょうか。
・D3.js
・Chart.js
・HighChart.js
・Chartist.js
データを分かりやすく伝える手段のひとつであるインフォグラフィックをつかって、より多くの人に情報を届けられると幸いです。
参考サイト
円グラフ
Circle Progress Bar Using Html CSS and SVG | CSS Percentage Circle
cssで円グラフを表示させる件@モーショングラフィックス風
棒グラフ
CodePen Home CSSで棒グラフ(アニメーション付き)
レーダーチャート
Pure CSS Radar Chart


